
WHAT IS PRIVATE CREDIT?
The private credit industry grew out of bank middle market lending, which tended to focus on companies that were traditionally considered too small for large banks to cover. Private credit firms stepped in, particularly after 2008, to lend to many of these companies as regulations forced banks to increase capital requirements for risky loans and while banks focused on rebuilding credit quality through investments to larger and higher quality clients. This growing so-called “shadow banking system” had a sinister sound to those looking for the next market implosion. The largest private credit funds – such as Apollo, Ares, Blackstone, and KKR – were also among the largest private equity (“PE”) firms. PE firms often used significant amounts of debt to purchase both public and private companies. This debt financing was often deemed investible through the promise of attractive yields, cash flow coverage, asset and collateral protection (i.e., seniority in the capital structure), and growth, particularly in industries like technology. The growth element gave many companies the option to either be sold or to go public at the end of their private-equity-owned life. By early 2026, the total private credit market had grown to as much as $3.5 trillion in assets, according to some estimates. Although many see mega-sized leveraged buyouts as the cornerstone of private credit, many private credit investments are simply loans made to smaller companies with the private credit firm acting as the lender who holds the debt in one or more of its funds. By creating portfolios with hundreds of different loans, the fund can pass cash flows back to investors after taking out management fees.
WHY SO MUCH BAD PRESS?
Since late 2025, the private credit market has been hit by a series of events that forced investors to take note.
High-profile collapses and fraud. Several borrowers have failed recently, including Tricolor Holdings (auto financing) and First Brands (auto parts), both of which involved fraudulent activity. More recently, a UK lender called Market Financial Solutions collapsed after being accused of using the same asset as collateral for multiple loans simultaneously. To be fair, while the media and investors tend to treat them all the same in moments of fear, these situations impacted asset-backed and receivables financing companies, which to some degree are different than private credit funds. Nonetheless, these events brought up serious questions about transparency and, most notably, underwriting standards.
The artificial intelligence (“AI”)/software problem. A significant portion of private credit was invested in loans to software companies – and now those companies are threatened by AI disrupting their business models. During Q1 2026, the S&P North American Expanded Technology Software Index, which is comprised of US-traded stocks in the software industry, dropped 35% from its September 2025 peak, declining as much as 27% from the start of the year, ultimately closing the quarter with a loss of 24%. Keep in mind that this index counts among its constituents some of the largest and most well-capitalized companies in the software sector. At best, the drawdowns imply lower multiples applied to future earnings and cash flows; at worst, the declines could also reflect decreases in long-term earnings – though this has not yet been reflected in analyst models.
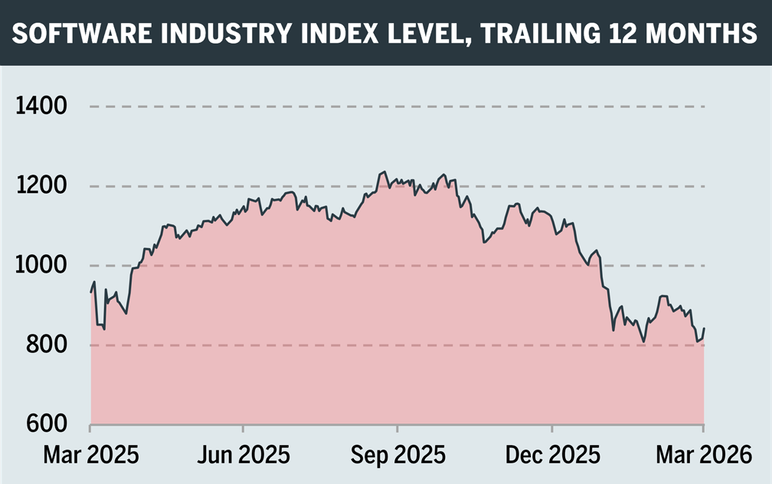
Source: Bloomberg. Date range: March 31, 2025-March 31, 2026. Past performance is not a guarantee of future results.
If this larger capitalized index is suffering from lower valuations, then we believe there is only one conclusion that can be made about the valuations of smaller companies with potentially higher leverage backing illiquid loans held by private credit funds. This is not to say anything about the path of earnings or survivability of those companies. It is simply a call for more accurate and more correlated marks in private credit portfolios. If the underlying businesses have lower valuations, then loan-to-value metrics must rise, which implies less asset coverage, and consequently should imply higher expected yields (i.e., lower prices on existing debt holdings). Hedge funds faced issues with mark-to-market pricing in the early 2000s, as did banks in 2008 with mortgages, and we expect that private credit may ultimately need to take more dramatic steps to confront valuation realities. We think this will lower the historic returns for these portfolios and it could force more regulatory scrutiny of the asset class.
The second issue given the unknown impact of AI on software companies is how, considering current market fears, these debts can be refinanced (likely at higher prevailing rates than when first issued) and whether it is still plausible to assume the ultimate sale of these companies in the future. The answer is that it is simply too early to tell, which will sustain anxiety with investors. Rebounds in equity markets will be a sign that perhaps markets were too bearish, but that dynamic remains unknown at this time.
Liquidity problems. While investors benefited from attractive rates of return offered by private credit funds, the excess returns should have been seen as compensation for owning illiquid loan assets and having low transparency into fund holdings. In hindsight, questions probably should have arisen after 2022 – a difficult period characterized by an unusually broad cross-asset drawdown, driven by inflation, aggressive central-bank tightening, and additional commodity/geopolitical shocks. Public market indices across credit and equity reflected double-digit declines, and nearly all public loan, bond, and high yield funds suffered heavy losses during the year. Even private equity and levered loan indices – the latter of which may be the closest public market proxy available for private credit – ended the year in the red. Similar drawdowns, however, were not observed in private credit. These significant performance discrepancies alone should start the process of regulators and investors asking hard questions about performance and “marking” portfolios.
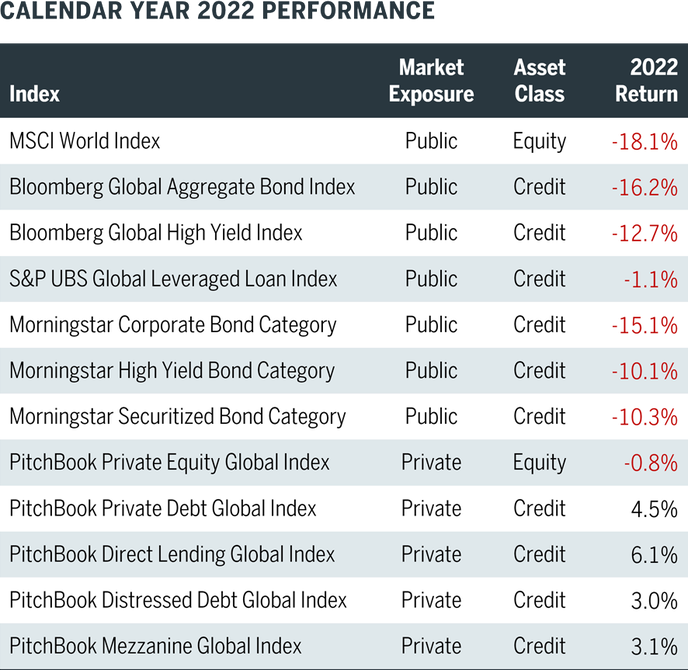
Source: Morningstar. Date range: January 1, 2022-December 31, 2022. Past performance is not a guarantee of future results.
Each of these factors has caused deep concerns, which have led investors to seek redemption of private credit funds holdings. Although many funds have redemption caps of roughly 5% per quarter to attempt to align the illiquidity of the assets with investor desire for some liquidity, these caps have been exceeded of late – as seen in recent headlines involving Blue Owl’s OBDC (Blue Owl Capital Corporation), Morgan Stanley’s North Haven Private Income Fund, and Cliffwater LLC’s flagship private credit fund which paid out 7% of redemption requests compared to 14% requested by investors. Frequent ongoing reporting of these and similar stories within the financial media only serves to reinforce investor fears of not being able to recoup capital.
IMPLICATIONS FOR OVERALL MARKETS
The levered loan market can serve as a good proxy for what is happening in private credit, since the companies and loans in levered loan indices are broadly sector-based, typically secured and at the top of corporate capital structures, and are floating rate. Many of the owners of these loans are mutual funds, collateralized loan obligations, and other types of investment funds. Below we show the overall performance and spreads for the broad index and then the performance and spreads for the technology sector. There we see even more dramatic moves which reflect both investor sentiment and selling.
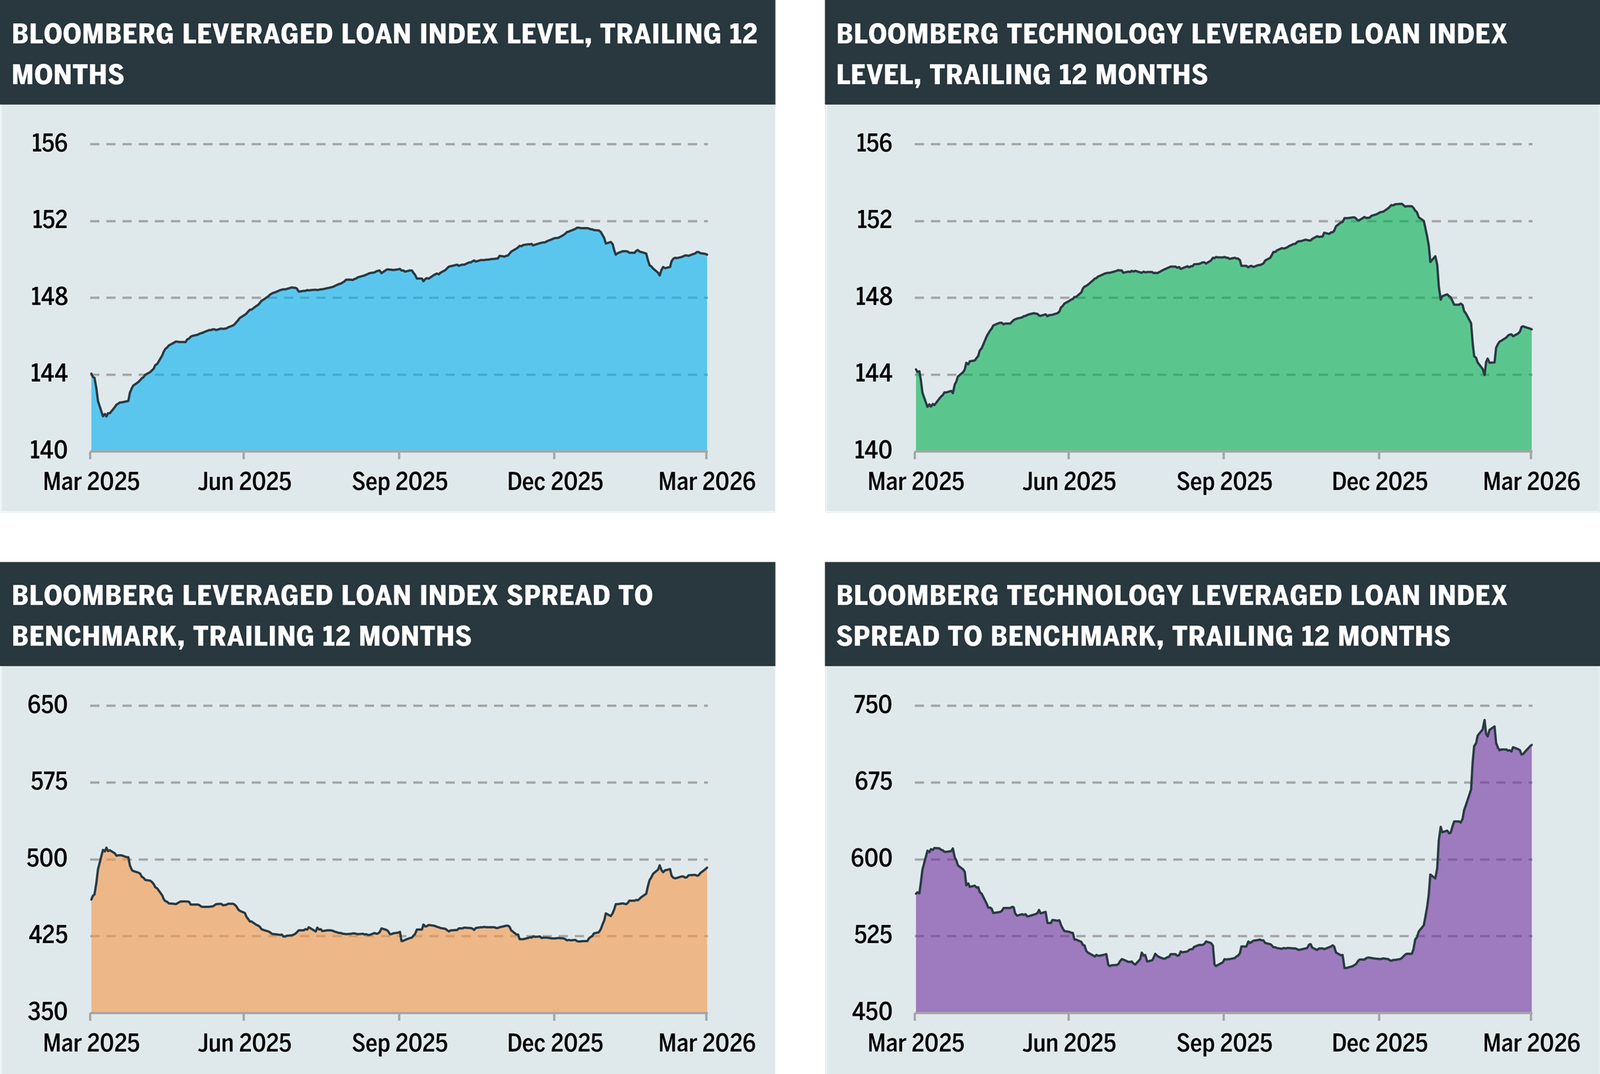
Source: Bloomberg. Date range: March 31, 2025-March 31, 2026. Past performance is not a guarantee of future results.
While much of the pressure on loan markets can be attributed to the poor performance of the technology sector, we anticipate potential redemptions and lack of investor flows into the loan market will hinder some mergers and acquisitions (“M&A”) financing, and we are likely to see a shift with financing activity moving to the high yield bond market to fill the void. We also expect that lower valuations in the software sector will ultimately lead to more M&A activity as time passes. We currently assume that the bid-ask spread between potential buyers and sellers is too large to bridge, but as volatility declines in the sector and share prices rise again, we think more activity will follow.
Although much of the recent market drama has focused on software, AI, and private credit, we continue to see numerous catalyst-driven opportunities ahead, including new M&A, refinancings, and busted convertibles. The weakness in loan markets has also brought about opportunities for investments in non-software term loans that are tied to future initial public offerings or potential M&A events.
Recent volatility has pushed credit spreads wider over Q1, and that has created more attractive entry points for many of the new transactions that we are examining. In our catalyst-driven credit portfolio, Water Island Credit Opportunities Fund, we continue to be invested in high yield bonds, loans, and convertible securities with a focus on catalysts that could result in the repayment of debt prior to stated maturities or in situations where we see capital appreciation opportunities with strong downside protection. Due to this focus on shorter duration events, we typically see positions roll off frequently – whether redeemed, retired, or called – throughout a fiscal year. Because of this, we can maintain high levels of liquidity and can invest in future transactions as opportunities arise.
Water Island Credit Opportunities aims to deliver a total return to clients comprised of both capital growth and income; historically, the yield component has represented approximately 70% of the fund’s yearly return. As always, we seek to generate performance with carefully selected positions and a strong focus on downside mitigation, delivering return streams that are more correlated with the timelines and outcomes of our investments in securities undergoing idiosyncratic corporate events rather than broader market direction. In this environment, given ongoing volatility and concerns around less liquid fixed income strategies, we believe Water Island Credit Opportunities is primed to serve as a useful component of many investor portfolios.
GLOSSARY: Asset-backed financing refers to a method of lending where loans are secured by collateral, such as equipment or inventory. The bid-ask spread is the difference between the highest price a buyer will pay and the lowest price a seller will accept for an asset. A busted convertible is a convertible bond in which the underlying stock trades materially below its conversion price, causing it to act solely as a bond given the low probability that it will reach its conversion price before maturity. A collateralized loan obligation is a structured security typically backed by a pool of lower-rated, predominantly senior secured corporate loans which are bundled and sold to investors in tranches. High yield refers to a bond with a credit rating lower than investment grade. Loan-to-value is a measure of the amount of a loan used to finance an asset relative to the appraised value of the asset. Mark-to-market refers to the act of measuring value using the most recent market price. Receivables financing refers to a financial arrangement in which a company uses its outstanding invoices as collateral to obtain a loan. Spread to benchmark is a measure of the difference in yield-to-maturity between a bond (or index of bonds) and a risk-free benchmark. A term loan provides borrowers with an upfront lump sum cash payment, to be repaid with interest over a set period through scheduled, fixed payments.
The Bloomberg Global Aggregate Bond Index measures the performance of global investment grade fixed-rate debt markets. The Bloomberg Global High Yield Index measures the performance of the global high-yield fixed income markets. The Bloomberg US Leveraged Loan Index (“Bloomberg Leveraged Loan Index”) measures the performance of USD-denominated securities in the high-yield, floating-rate, institutional leveraged loan market. The Bloomberg US Leveraged Loan Index: Technology (“Bloomberg Technology Leveraged Loan Index”) measures the performance of USD-denominated securities in the high-yield, floating-rate, institutional leveraged loan market issued by companies in the technology sector. The Morningstar Corporate Bond Category includes funds which typically invest at least 65% of their assets in investment-grade bonds issued by corporations in US dollars, with less than 40% of their assets in non-US debt and less than 35% in below-investment-grade debt. The Morningstar Diversified Securitized Bond Category (“Morningstar Securitized Bond Category”) includes funds which typically have at least 65% exposure to investment-grade securitized sectors, which may include government and nonagency residential mortgage debt, commercial mortgage-backed securities, collateralized loan obligations, or a variety of other asset-backed debt. The Morningstar High Yield Bond Category includes funds which concentrate on lower-quality bonds, typically investing at least 65% of their bond portfolio in high income debt securities which are either not rated or rated at speculative grade or below by a major rating agency. The MSCI World Index measures the performance of the large- and mid-cap segments of world equity securities in developed markets. The PitchBook Direct Lending Global Index measures the performance of closed-end, finite-life private direct lending funds globally in the PitchBook fund universe with available cash flow and net asset value data. The PitchBook Distressed Debt Global Index measures the performance of closed-end, finite-life private distressed debt funds globally in the PitchBook fund universe with available cash flow and net asset value data. The PitchBook Mezzanine Global Index measures the performance of closed-end, finite-life private mezzanine funds globally in the PitchBook fund universe with available cash flow and net asset value data. The PitchBook Private Debt Global Index measures the performance of closed-end, finite-life private debt funds globally in the PitchBook fund universe with available cash flow and net asset value data. The PitchBook Private Equity Global Index measures the performance of closed-end, finite-life private equity funds globally in the PitchBook fund universe with available cash flow and net asset value data. The S&P North American Expanded Technology Software Index (“Software Industry Index”) measures the performance of US-traded securities that are classified under the GICS application software, systems software, home entertainment software sub-industries, and applicable supplementary stocks. The S&P UBS Global Leveraged Loan Index measures the performance of the global investible universe of the USD-denominated leveraged loan market. Indexes are unmanaged and one cannot invest directly in an index. Indexes are shown for informational purposes only. Indexes are not intended to, and do not, parallel the risk or investment style of the fund’s investment strategy.
Commentary represents the manager’s opinion and contains certain forward-looking statements which may be different than actual future results, is subject to change, and is under no obligation to be updated. Commentary should not be regarded as investment advice or a recommendation of any security or strategy.
RISKS: Investments are subject to risk, including possible loss of principal. There can be no assurance that the fund will achieve its investment objectives. The fund uses investment techniques and strategies with risks that are different from the risks ordinarily associated with credit investments. Such risks include event-driven risk; merger arbitrage risk (in that the proposed reorganizations in which the fund invests may be renegotiated or terminated, in which case the fund may realize losses); active management risk; credit risk; convertible security risk; liquidity risk; market risk; sector risk; interest rate risk; short sale risk; hedging transaction risk; large shareholder transaction risk; leverage risk; high portfolio turnover risk (which may increase the fund’s brokerage costs, which would reduce performance); counterparty risk; temporary investment/cash management risk; swap risk; options risk; preferred securities risk; investment company and ETF risk; derivatives risk; currency risk; and foreign securities risk. Risks may increase volatility, increase costs, and lower performance.